All charts and tables below reflect the data release on 9/3/2021 from the VAERS website, which includes U.S. and foreign data, and is updated through: 8/27/2021
| High-Level Summary | COVID19 vaccines (Dec’2020 – present) | All other vaccines 1990-present | US Data Only COVID19 vaccines (Dec’2020 – present) | US Data Only All other vaccines 1990-present |
|---|---|---|---|---|
| Number of Adverse Reactions | 650,077 | 816,672 | 514,270 | 716,311 |
| Number of Life-Threatening Events | 14,327 | 13,435 | 8,056 | 9,583 |
| Number of Hospitalizations | 56,912 | 77,886 | 29,079 | 37,747 |
| Number of Deaths | 13,911* | 8,886 | 6,296 | 5,018 |
| # of Permanent Disabilities after vaccination | 18,098 | 19,104 | 7,312 | 12,038 |
| Number of Office Visits | 103,836 | 42,610 | 97,329 | 41,327 |
| # of Emergency Room/Department Visits | 76,103 | 209,083 | 66,367 | 200,156 |
| # of Birth Defects after vaccination | 405 | 138 | 285 | 89 |
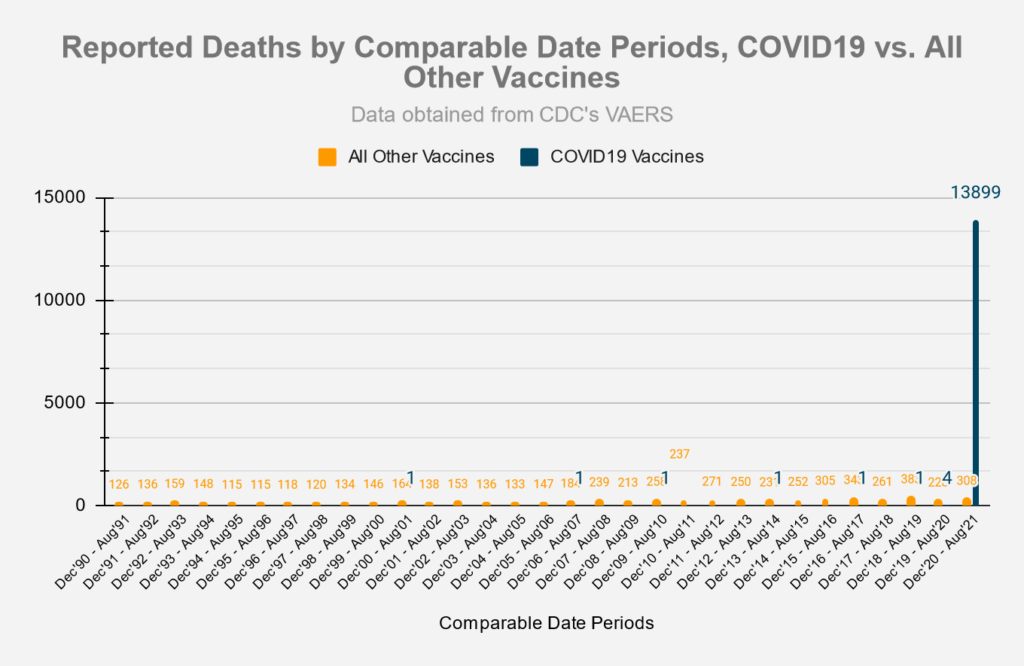
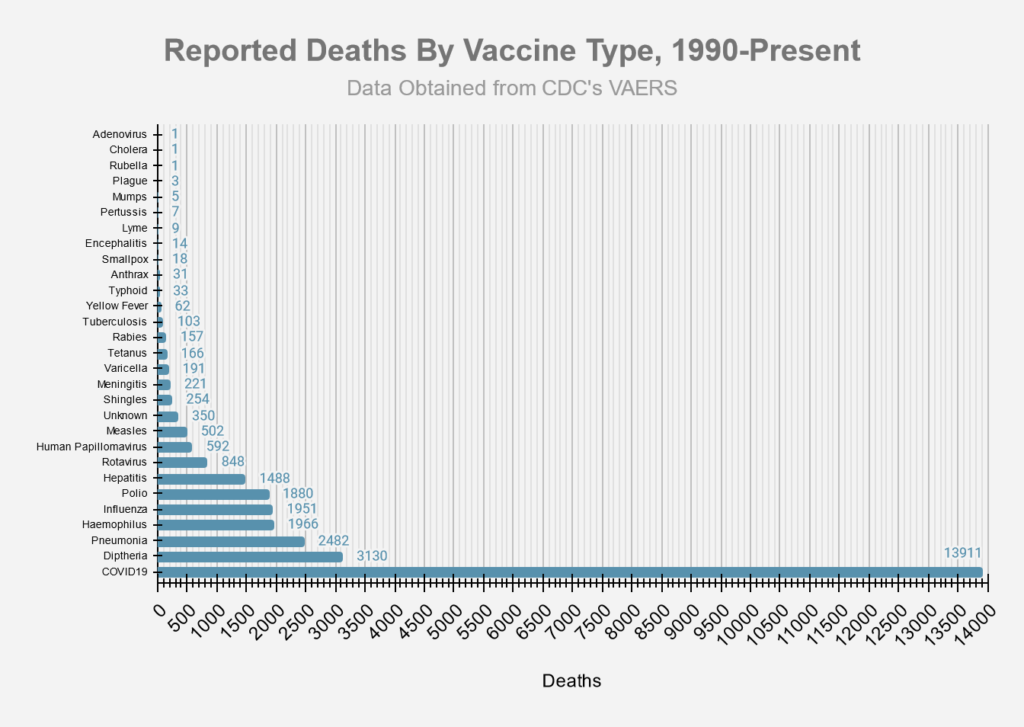
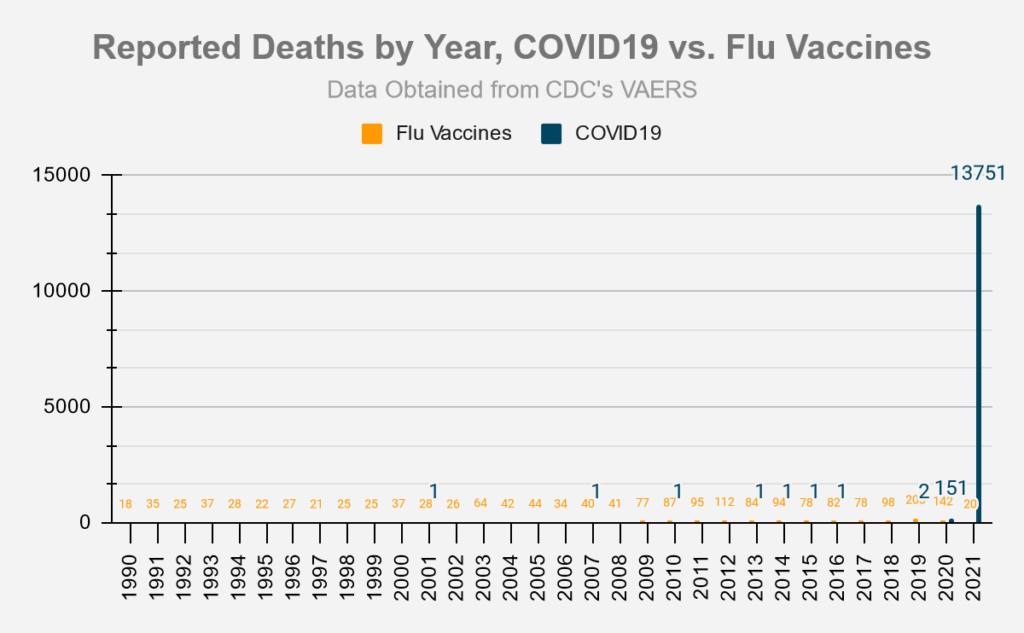
Deaths

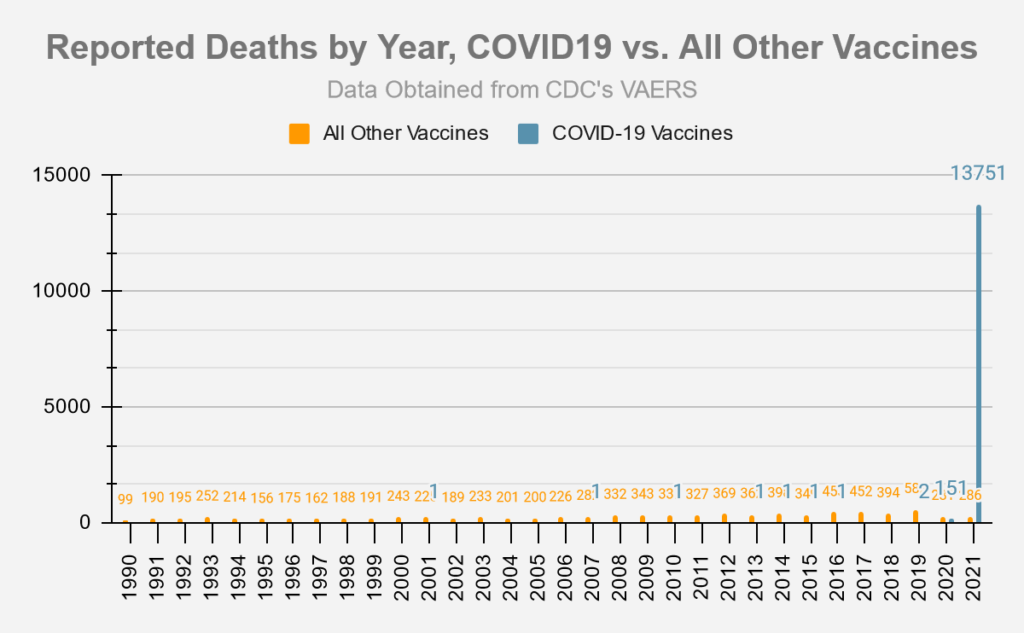
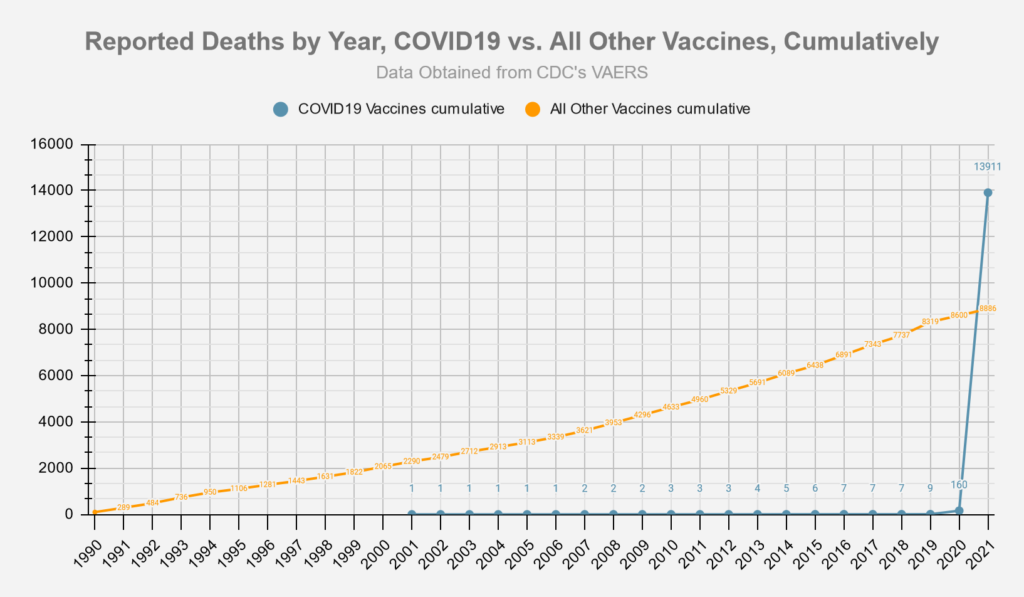
Chart using comparable 9 month periods, since Covid-19 vaccines have only been available for approximately 9 months:
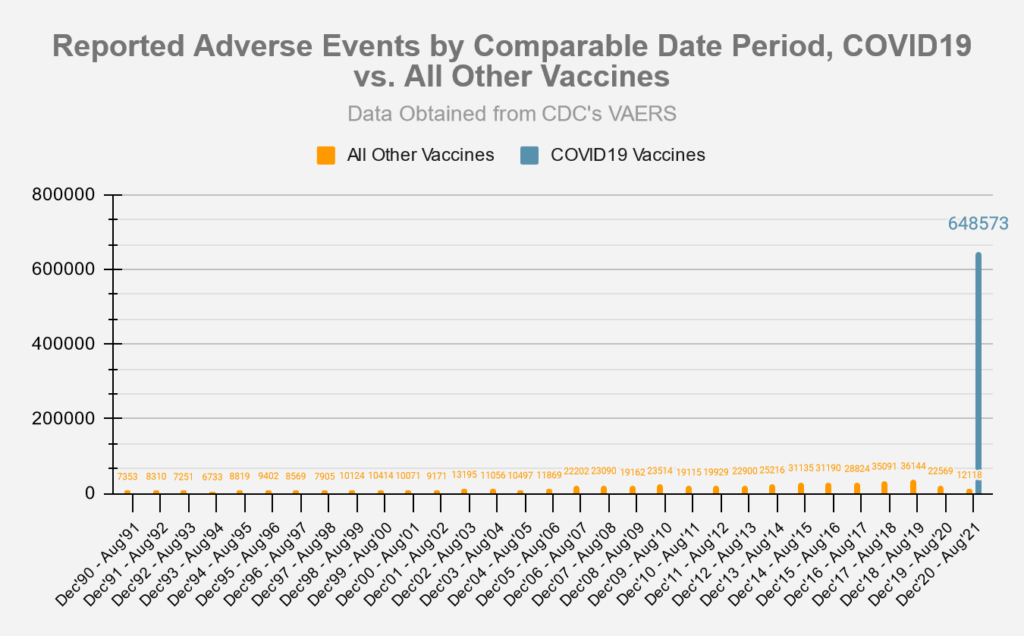
Adverse Events
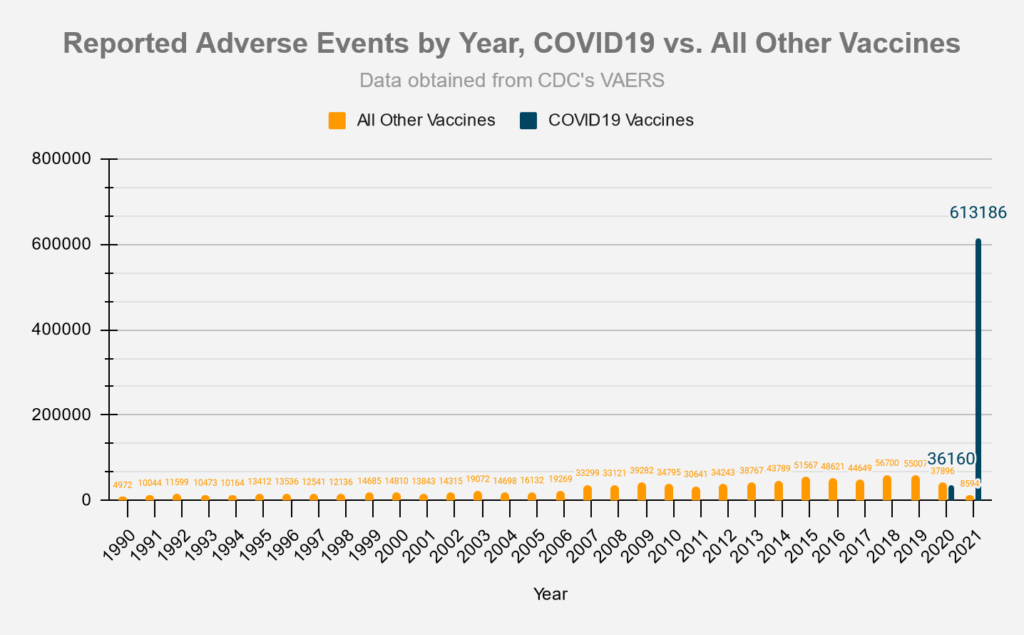
Chart using comparable 9 month periods, since Covid-19 vaccines have only been available for approximately 9 months:
Symptoms
The slide below was taken from an FDA document from October 22, 2020 and provides a list of possible adverse event outcomes related to the Covid-19 vaccines.
- Source: ‘Vaccines and Related Biological Products Advisory Committee October 22,2020 Meeting Presentation”.
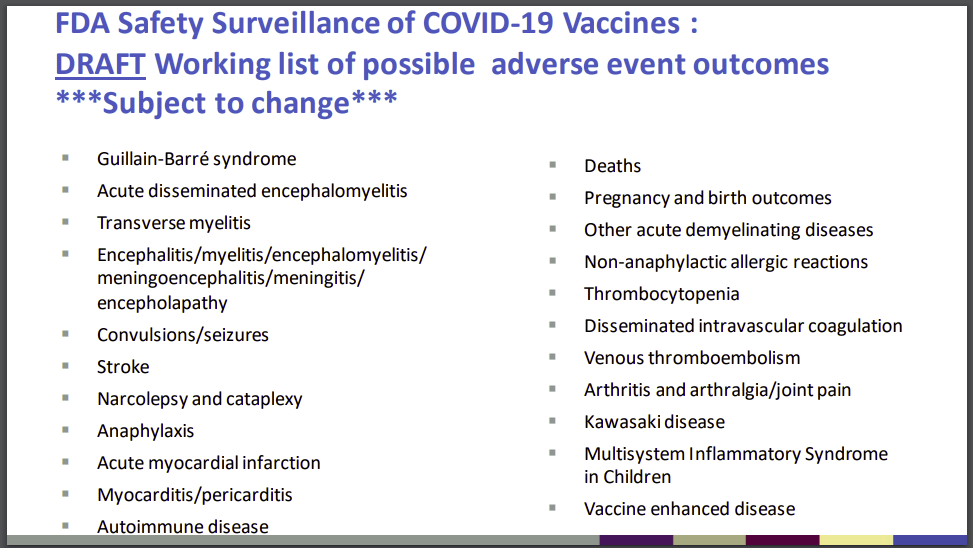
The following table lists the number of adverse events found in the VAERS data which match the outcomes listed above:
| FDA Listed Symptom | Total (Non-Lethal) Adverse Events | Total Deaths |
|---|---|---|
| Guillain-Barre | 937 | 19 |
| Acute Disseminated Encephalomyelitis | 65 | 2 |
| Transverse Myelitis | 202 | 0 |
| Encephalitis | 810 | 85 |
| Convulsions/Seizures | 8049 | 248 |
| Stroke | 7598 | 758 |
| Narcolepsy, Cataplexy | 139 | 3 |
| Anaphylaxis | 30535 | 129 |
| Acute Myocardial Infarction (Heart Attack) | 2055 | 724 |
| Myocarditis/Pericarditis | 4353 | 71 |
| Autoimmune Disease | 554 | 16 |
| Other Acute Demyelinating Diseases | 134 | 1 |
| Pregnancy and birth outcomes (Miscarriages) | 1586 | 43 |
| Other Allergic Reactions | 1165 | 1 |
| Thrombocytopenia | 2439 | 197 |
| Disseminated Intravascular Coagulation | 109 | 36 |
| Venous Thromboembolism | 11031 | 666 |
| Arthritis and Arthralgia/Joint Pain | 43036 | 123 |
| Kawasaki Disease | 27 | 1 |
| Systemic Inflammatory Response Syndrome | 341 | 20 |
Vaccination Related Risks of COVID19 Vs. Flu
These set of figures compare the COVID19 vaccine to the traditional Flu vaccines. ‘Risk of Death’ percentages depend on the ‘# of Vaccinations’ data, which is only approximate, and was pulled from the CDC’s report on Flu vaccination coverage for the 2019-2020 season, and from Our World in Data for the COVID19 vaccinations.
Covid19 vaccinations through 5/31/2021 vs. Flu vaccinations 7/1/2019 – 5/31/2020 (last complete flu season)
| Vaccine Type | # of Vaccinations[3] | # of Deaths | Risk of Death | Percentage | Deaths/Mill. Vaccinations[3] |
|---|---|---|---|---|---|
| Flu | 167,447,642[1] | 31 | 1 in 5,401,537 | 0.000019% | .19 |
| COVID19 | 167,733,972[2] | 5,289 | 1 in 31,714 | 0.003153% | 31.53 |
| Vaccine Type | # of Vaccinations[3] | # of Adverse Reactions | Risk of Adverse Reaction | Percentage | AEs/Mill. Vaccinations[3] |
|---|---|---|---|---|---|
| Flu | 167,447,642 | 9,665 | 1 in 17,325 | 0.005772% | 57.72 |
| COVID19 | 167,733,972 | 465,243 | 1 in 361 | 0.2774% | 2,773.70 |
[1] number of flu vaccinations based on estimated flu vaccine coverage data from CDC and estimated population data from US Census. Yearly flu vaccination data covers a period of time from 7/1 to 5/31 of the following year.
[2] number of covid19 vaccinations based on estimates from Our World in Data [2] number of covid19 vaccinations based on estimates from Our World in Data
[3] Persons vaccinated with at least one dose.
Vaccine Data by Manufacturer
| Manufacturer | # of Deaths | % Deaths | Average Deaths/Day | # US Deaths | US Doses Administered | Average US Deaths/Mill. Doses | Days since EUA approval | EUA Approval Date- |
|---|---|---|---|---|---|---|---|---|
| Janssen (JNJ) | 826 | 5.93% | 4.54 | 625 | 14,420,976 | 43.34 | 182 | 2/26/2021 |
| Moderna | 3429 | 24.64% | 13.61 | 2873 | 145,967,563 | 19.68 | 252 | 12/18/2020 |
| Pfizer/Biontech | 9622 | 69.13% | 37.15 | 2774 | 211,373,074 | 13.12 | 259 | 12/11/2020 |
| Unknown | 42 | 0.3% | 29 | 355,004 |
| Manufacturer | # of AEs | % AEs | Average AEs/Day | # US AEs | US Doses Administered | Average US AEs/Mill. Doses | Days since EUA approval | EUA Approval Date |
|---|---|---|---|---|---|---|---|---|
| Janssen (JNJ) | 51842 | 7.97% | 284.85 | 49087 | 14,420,976 | 3403.86 | 182 | 2/26/2021 |
| Moderna | 260423 | 40.02% | 1033.42 | 246130 | 145,967,563 | 1686.2 | 252 | 12/18/2020 |
| Pfizer/Biontech | 337089 | 51.81% | 1301.5 | 218470 | 211,373,074 | 1033.58 | 259 | 12/11/2020 |
| Unknown | 1316 | 0.2% | 1094 | 355,004 |
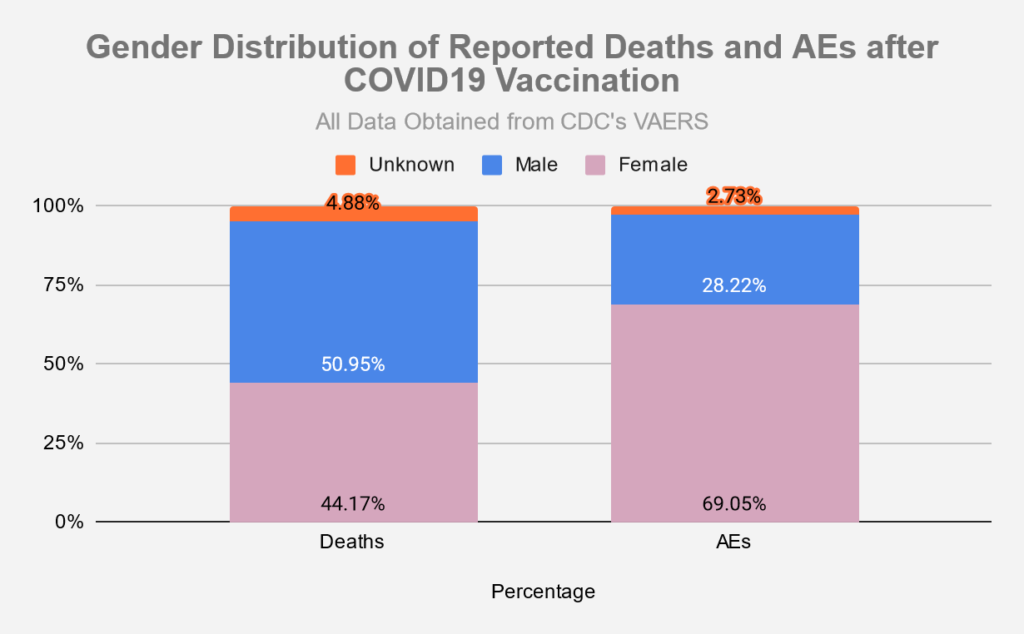
Vaccine Data by Gender
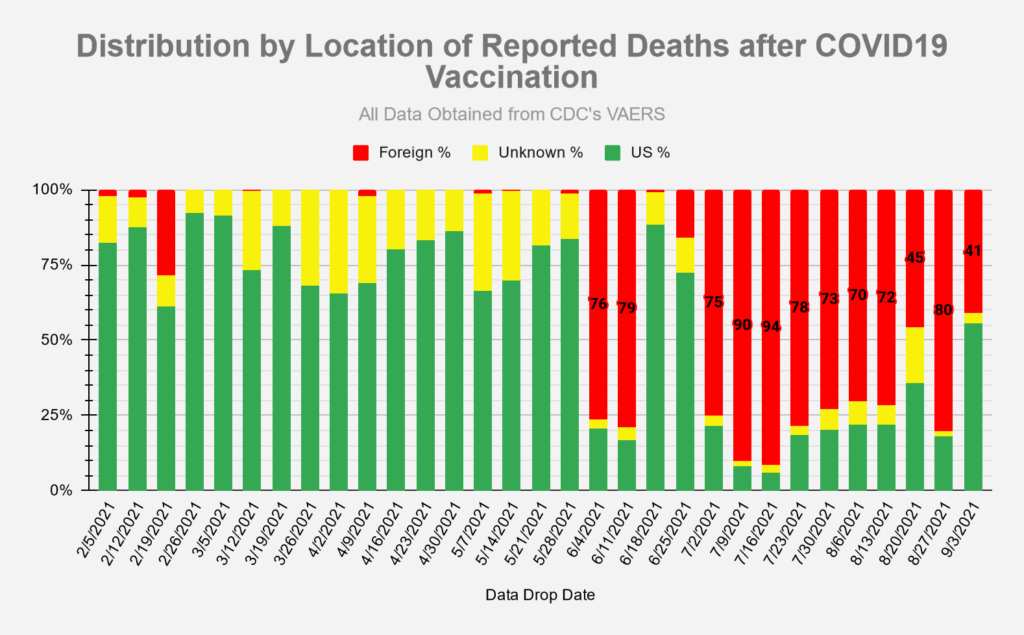
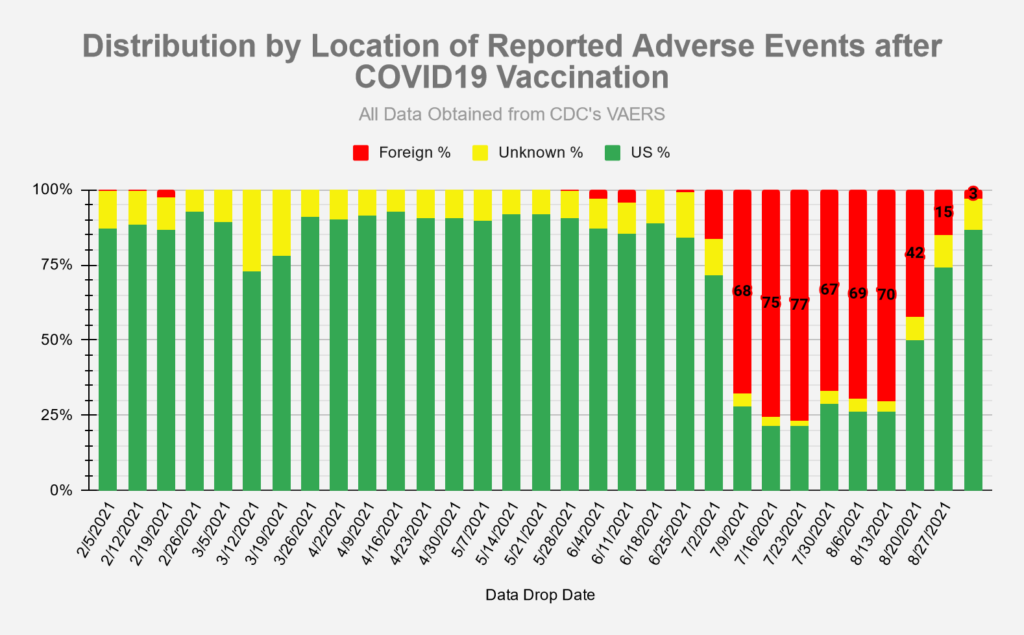
Vaccine Data by Location
Sources
- Vaccine data (Covid-19 and other vaccines) taken from CDC’s VAERS website, located here: https://vaers.hhs.gov/data/datasets.html. VAERS data sets in the form of csv files are pulled down weekly and put into a database for reporting/analysis. Data files are available all the way back to 1990.
- Number of doses distributed for other vaccines found in NVICP Data and Statistics report here: https://www.hrsa.gov/sites/default/files/hrsa/vaccine-compensation/data/data-statistics-report.pdf
- Numbers for Covid-19 vaccines administered by manufacturer found here: https://covid.cdc.gov/covid-data-tracker/#vaccinations_vacc-total-admin-rate-total
- Numbers for total Covid-19 vaccine doses administered found here: https://data.cdc.gov/Vaccinations/COVID-19-Vaccination-Trends-in-the-United-States-N/rh2h-3yt2
- Numbers for Flu vaccine doses administered for 2019-2020 season found here: https://www.cdc.gov/flu/fluvaxview/coverage-1920estimates.htm
I have noticed considerable amount of joint pain & arthritis pain since both moderna vaccines. It has made it hard to even live. Also my liver or kidneys is acting up. Inflammatory response.
Where do I report this?
Sorry to hear about your issues…you are not alone. Report it to VAERS here: https://vaers.hhs.gov/reportevent.html. Beware of timeouts while trying to submit…as it can be a frustrating experience I hear. I am not a doc, so this doesn’t constitute medical advice, but if I were you I would be getting on some treatment protocols for ‘Long Covid’. Many people are having good results with ivermectin and other re-purposed, safe drugs on these protocols. Obviously, this may entail looking outside the traditional medical system which often neither acknowledges vax injury nor has any clue how to treat it. There are scientists/docs now coming up with tests that can detect the level of micro-blood clotting (eg. d-dimer test) that may be going on inside of you that may not be detectable through traditional medicine. Bruce Patterson comes to mind…https://covidlonghaulers.com/
also look at the treatment protocols at this link: https://vaersanalysis.info/2021/07/02/are-there-alternatives-to-the-covid-19-vaccines-for-the-treatment-prevention-of-sars-cov2/
Good luck.
It looks like there is an error in “Vaccination Related Risks of COVID19 Vs. Flu” table. Both numbers of deaths from flu vacc and COVID vacc seem 3x smaller than in previous summaries. Is that some calculation error?
if you look at the 8/20/21 summary , at the very top is the explanation.
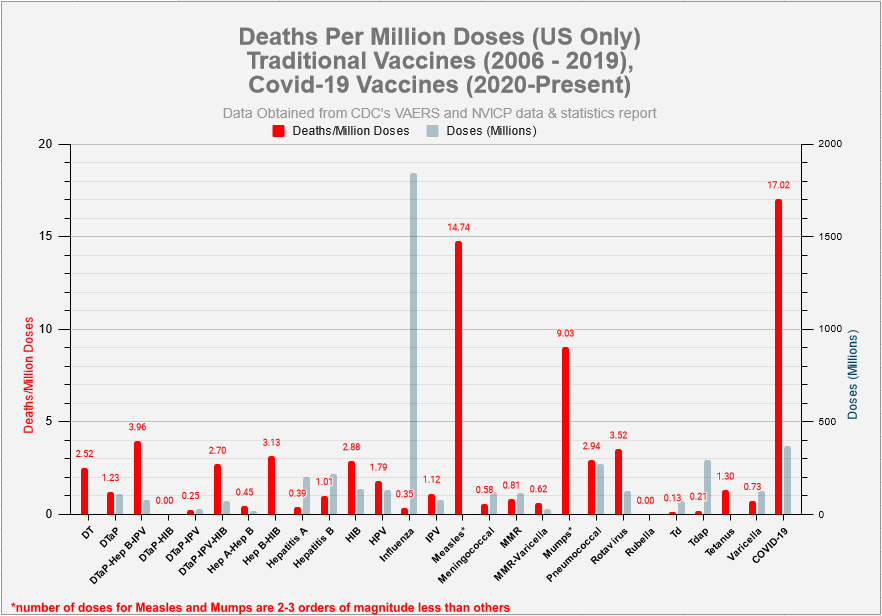
Thank you, I haven’t seen that. There was still some discrepancy that led me to thinking it is an error: the COVID vaccine vs other vaccines graph (17.02 deaths per million doses for COVID vacc) and the flu vacc vs COVID vacc (31.53 deaths per million doses), although that looks like a different set of data which may explain it.
It would be great to compare your findings with another database, I heard Netherlands have quite a good reporting.
Overall – great job, invaluable if you consider the quality of information you get through the mass media. Thanks a lot for your efforts!
Hi Frank, Thank you! I appreciate you pointing out the error (or lack of clarity). The discrepancy is that the flu vax vs covid vax numbers are for number of persons vaccinated with at least one dose, which is around 168m, whereas the other chart uses actual doses, which is around 372m. I’ve added a footnote to the flu vs covid vax section to make it clearer. One of these days, the plan is to re-check everything on the site looking for any other errors or things that could be better clarified.
They have updated the number of deaths fro 12000 roughly back down to 6000 roughly. Have you reflected this and do you have any reason to disagree with this?
if you are talking about what happened back on 7/20-7/21 on this page, which usually only reports US deaths, what likely happened is that sometime on 7/20 they reported all deaths (US+foreign), thereby making it ~12K instead of the usual ~6K. Essentially, they made a mistake, and reverted it back to normal the next day. You can see exactly what happened for yourself by checking the history on https://web.archive.org/.
[…] like these figures are only for breakthrough infection deaths, because the CDC VAERS database indicates more than 6,000 vaccine deaths (through August 27) that are reported as vaccine adverse […]
[…] like these figures are only for breakthrough infection deaths because the CDC VAERS database indicates more than 6,000 vaccine deaths (through August 27) that are reported as vaccine adverse […]
[…] like these figures are only for breakthrough infection deaths, because the CDC VAERS database indicates more than 6,000 vaccine deaths (through August 27) that are reported as vaccine adverse […]
[…] seems like these figures are only for breakthrough infection deaths, because the CDC VAERS database indicates more than 6,000 vaccine deaths (through August 27) that are reported as vaccine adverse effects. […]
[…] like these figures are only for breakthrough infection deaths, because the CDC VAERS database indicates more than 6,000 vaccine deaths (through August 27) that are reported as vaccine adverse […]
[…] like these figures are only for breakthrough infection deaths, because the CDC VAERS database indicates more than 6,000 vaccine deaths (through August 27) that are reported as vaccine adverse […]
[…] seems like these figures are only for breakthrough infection deaths because the CDC VAERS database indicates more than 6,000 vaccine deaths (through August 27) that are reported as vaccine adverse […]
Can you explain the huge increase in deaths and adverse events reported from foreign locations? Sounds like fraudulent reports to me
I don’t think the foreign reports are fraudulent, but what seems very shady is the CDC’s multi-week pattern of barely trickling out US Deaths, while loading up a lot of foreign deaths instead. While at the same time, the overall weekly number of US AEs is much greater than the number of Foreign AEs.
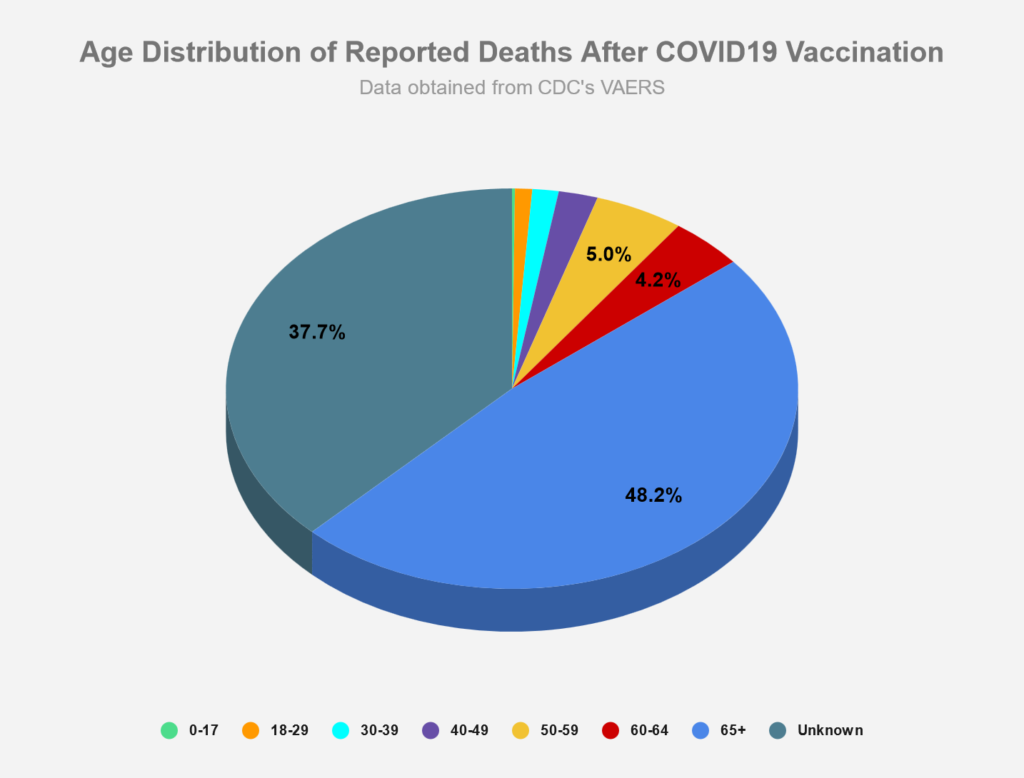
Who are these foreign deaths? Does this mean a death that occurred in a foreign location, or reported from a foreign location? Do these deaths have identifying information so that they can be verified. It is also remarkable that 37.7% of reported deaths do not report age. Reporting DOB is standard
we’ll use the CDC’s definition for the foreign reports in the advisory guide to the interpretation of VAERS data—
VAERS occasionally receives case reports from US manufacturers that were reported to their foreign subsidiaries. Under FDA regulations, if a manufacturer is notified of a foreign case report that describes an event that is both serious and unexpected (in other words, it does not appear in the product labeling), they are required to submit it to VAERS. It is important to realize that these case reports are of variable data quality and completeness, due to the many differences in country reporting practices and surveillance system quality.
Yes, quality control of the VAERS data is severely lacking and could give any rational person the impression that they don’t give a rat’s a** about your health…
[…] seems like these figures are only for breakthrough infection deaths because the CDC VAERS database indicates more than 6,000 vaccine deaths (through August 27) that are reported as vaccine adverse effects. […]
[…] VAERS Summary for COVID-19 Vaccines through 8/27/2021 […]
This data is garbage
[…] [25] See VAERS Summary for COVID-19 Vaccines through 8/27/2021 – VAERS Analysis. The best video on understanding VAERS is VAERS UPDATE for CCCA (Canadian COVID Care Alliance) – YouTube by Dr. Jessica Rose. […]
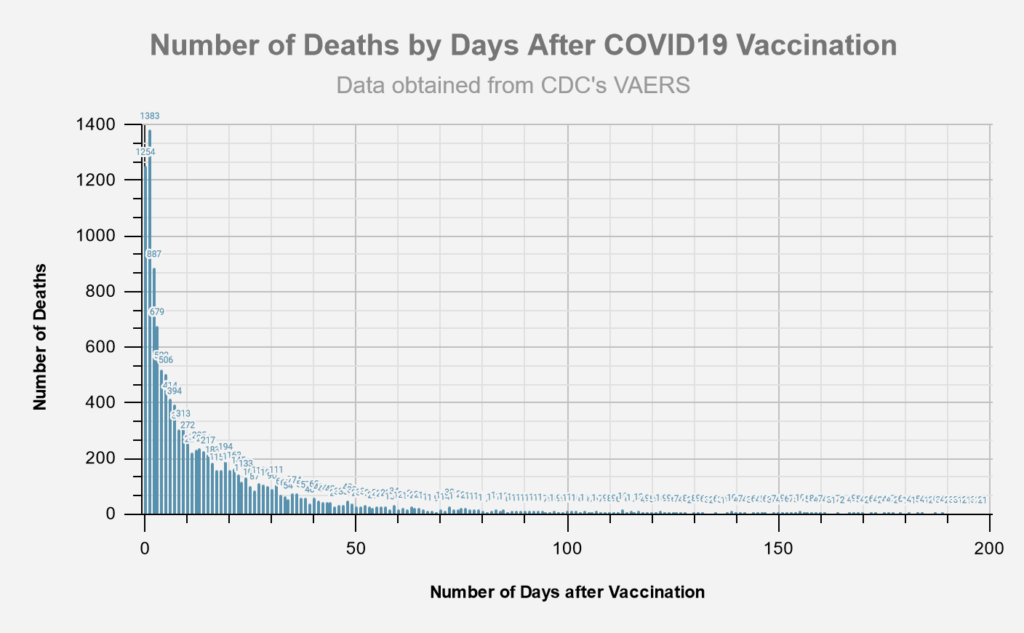
[…] blood clots in 12-to 17-year-olds, nearly all following the Pfizer shot (Redshaw, 2021c). The extremely tight clustering of VAERS deaths in the hours and days following “vaccination”—based on data accumulating from March to August 2021—forms a steeply decelerating smooth curve […]
[…] of blood clots in 12-to 17-year-olds, nearly all following the Pfizer shot (Redshaw, 2021c). The extremely tight clustering of VAERS deaths in the hours and days following “vaccination”—based on data accumulating from March to August 2021—forms a steeply decelerating smooth curve […]
Why is the data over a year old?