All charts and tables below reflect the data release on 10/29/2021 from the VAERS website, which includes U.S. and foreign data, and is updated through: 10/22/2021
| High-Level Summary | COVID19 vaccines (Dec’2020 – present) | All other vaccines 1990-present | US Data Only COVID19 vaccines (Dec’2020 – present) | US Data Only All other vaccines 1990-present |
|---|---|---|---|---|
| Number of Adverse Reactions | 856,919 | 845,019 | 634,609 | 741,881 |
| Number of Life-Threatening Events | 20,110 | 13,800 | 9,726 | 9,795 |
| Number of Hospitalizations | 88,910 | 79,519 | 38,818 | 38,476 |
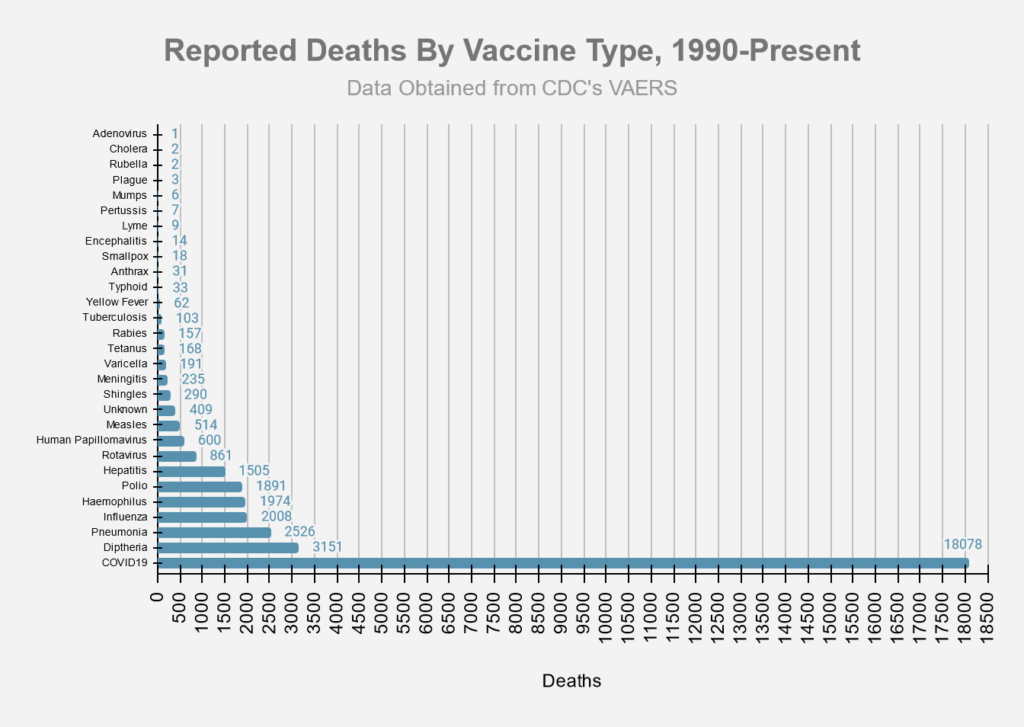
| Number of Deaths | 18,078* | 9,215 | 8,284 | 5,178 |
| # of Permanent Disabilities after vaccination | 28,112 | 19,929 | 9,580 | 12,615 |
| Number of Office Visits | 133,972 | 46,456 | 121,100 | 44,979 |
| # of Emergency Room/Department Visits | 95,898 | 211,090 | 79,615 | 202,004 |
| # of Birth Defects after vaccination | 610 | 153 | 363 | 97 |
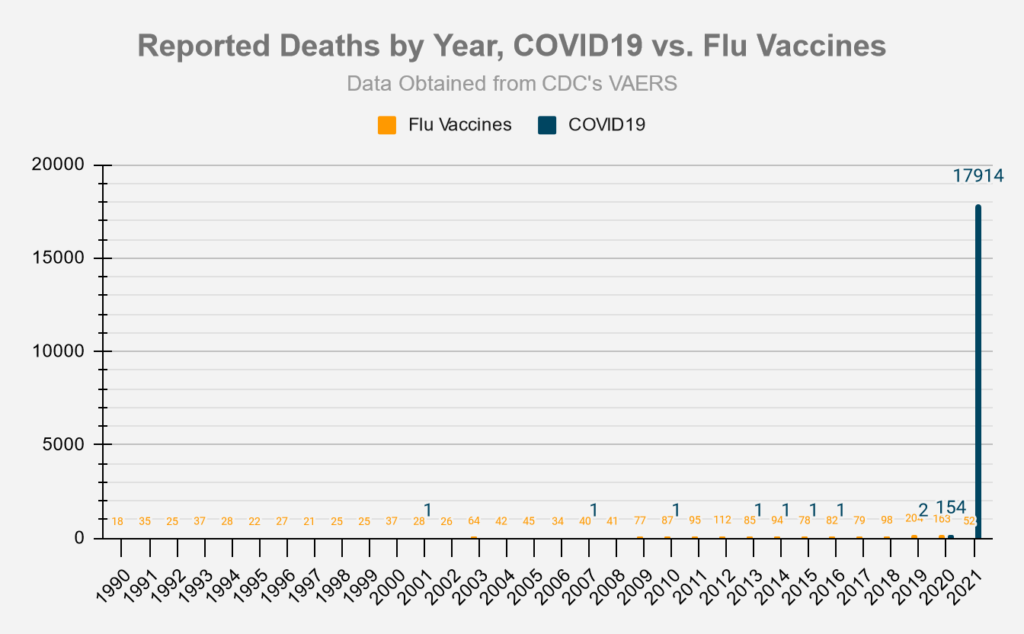
Deaths
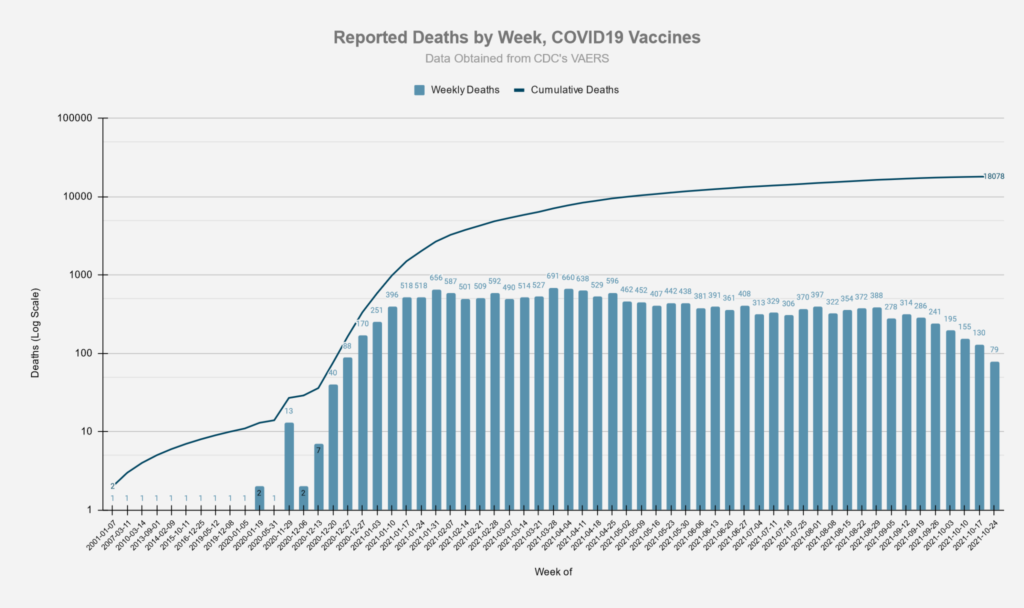
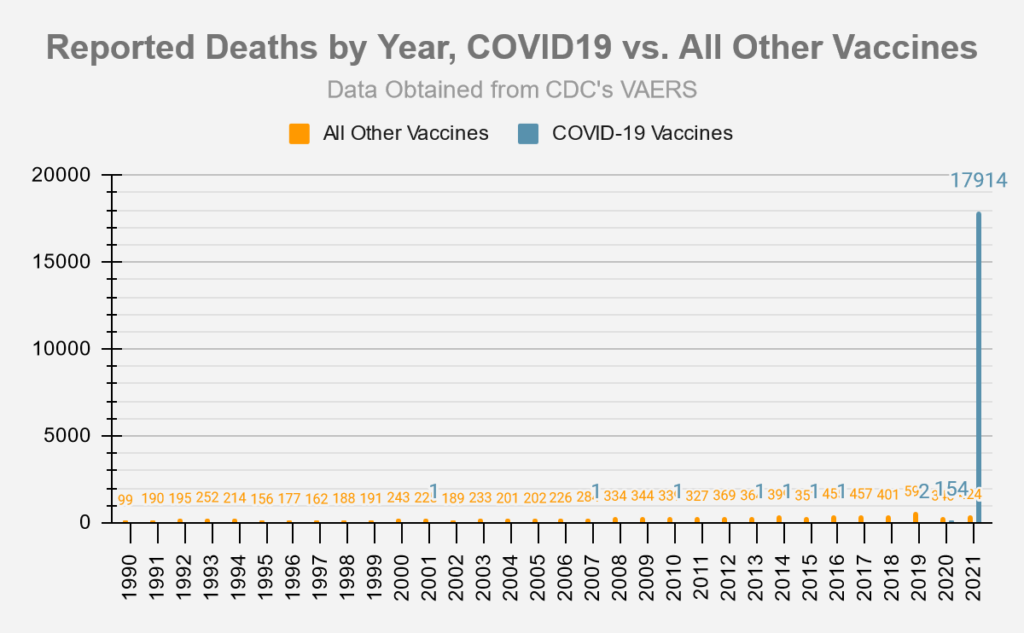

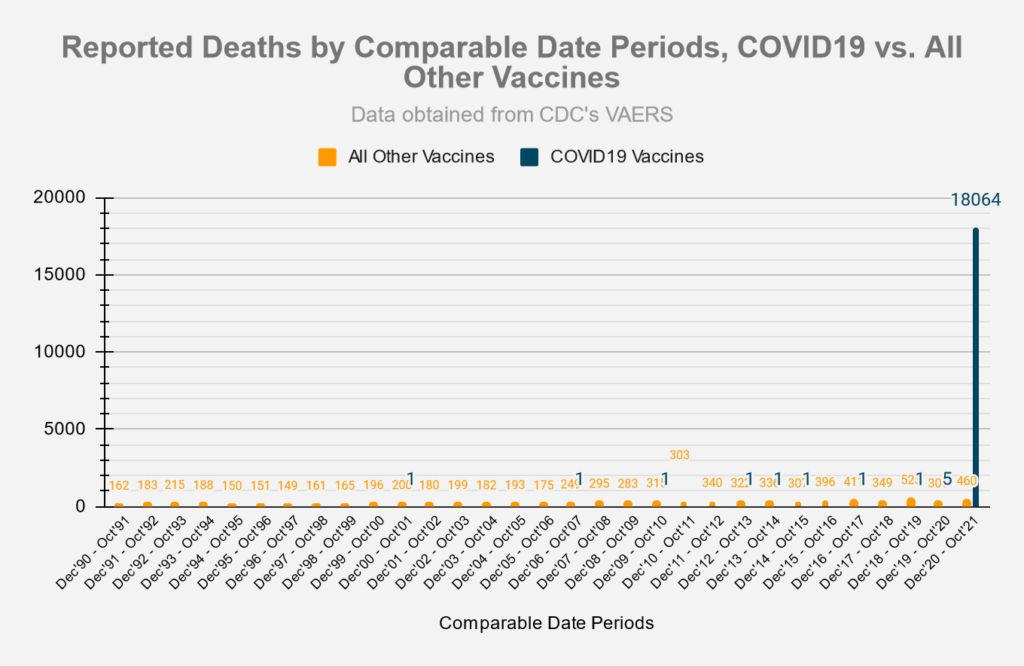
Chart using comparable 9 month periods, since Covid-19 vaccines have only been available for approximately 9 months:
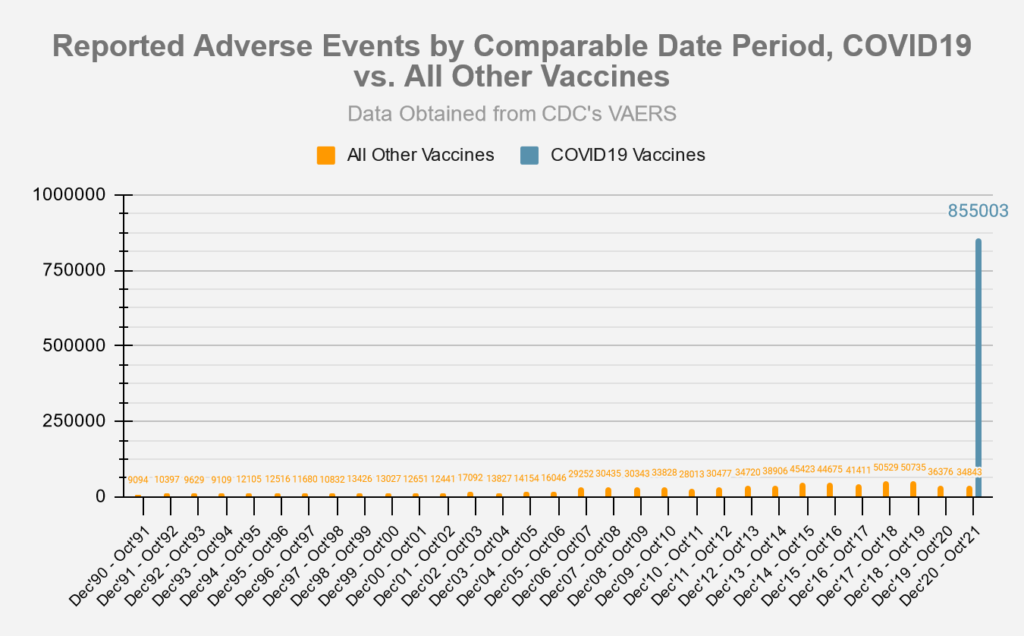
Adverse Events

Chart using comparable 9 month periods, since Covid-19 vaccines have only been available for approximately 9 months:

Symptoms
The slide below was taken from an FDA document from October 22, 2020 and provides a list of possible adverse event outcomes related to the Covid-19 vaccines.
- Source: ‘Vaccines and Related Biological Products Advisory Committee October 22,2020 Meeting Presentation”.
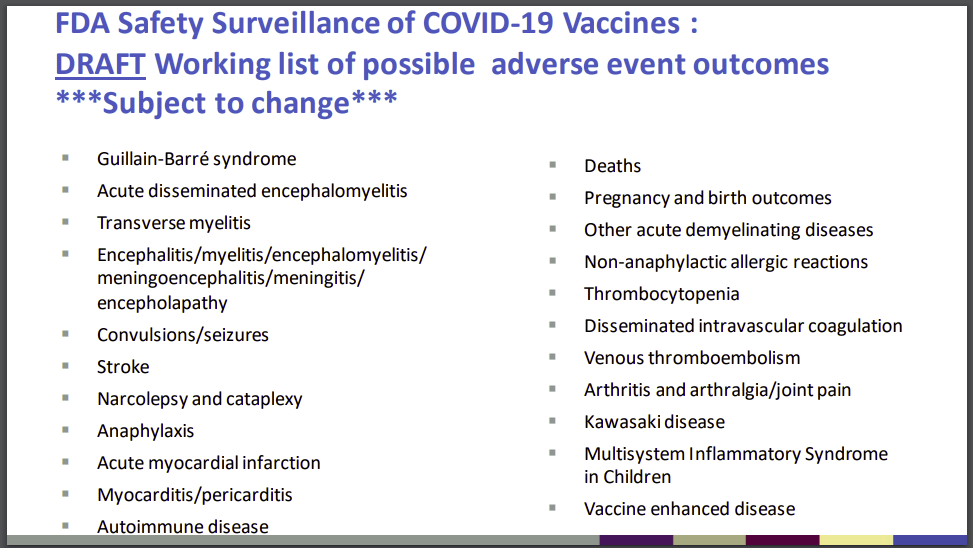
The following table lists the number of adverse events found in the VAERS data which match the outcomes listed above:
| FDA Listed Symptom | Total (Non-Lethal) Adverse Events | Total Deaths |
|---|---|---|
| Guillain-Barre | 1592 | 28 |
| Acute Disseminated Encephalomyelitis | 110 | 3 |
| Transverse Myelitis | 283 | 1 |
| Encephalitis | 1312 | 125 |
| Convulsions/Seizures | 10849 | 321 |
| Stroke | 10175 | 942 |
| Narcolepsy, Cataplexy | 210 | 4 |
| Anaphylaxis | 37894 | 150 |
| Acute Myocardial Infarction (Heart Attack) | 2918 | 916 |
| Myocarditis/Pericarditis | 9922 | 123 |
| Autoimmune Disease | 891 | 18 |
| Other Acute Demyelinating Diseases | 209 | 2 |
| Pregnancy and birth outcomes (Miscarriages) | 2589 | 77 |
| Other Allergic Reactions | 1639 | 3 |
| Thrombocytopenia | 3551 | 271 |
| Disseminated Intravascular Coagulation | 156 | 45 |
| Venous Thromboembolism | 15667 | 875 |
| Arthritis and Arthralgia/Joint Pain | 56487 | 170 |
| Kawasaki Disease | 36 | 1 |
| Systemic Inflammatory Response Syndrome | 484 | 35 |
Vaccination Related Risks of COVID19 Vs. Flu
These set of figures compare the COVID19 vaccine to the traditional Flu vaccines. ‘Risk of Death’ percentages depend on the ‘# of Vaccinations’ data, which is only approximate, and was pulled from the CDC’s report on Flu vaccination coverage for the 2019-2020 season, and from Our World in Data for the COVID19 vaccinations.
Covid19 vaccinations through 5/31/2021 vs. Flu vaccinations 7/1/2019 – 5/31/2020 (last complete flu season)
| Vaccine Type | # of Vaccinations[3] | # of Deaths | Risk of Death | Percentage | Deaths/Mill. Vaccinations[3] |
|---|---|---|---|---|---|
| Flu | 167,447,642[1] | 32 | 1 in 5,232,739 | 0.000019% | .19 |
| COVID19 | 167,733,972[2] | 5,506 | 1 in 30,463 | 0.003283% | 32.83 |
| Vaccine Type | # of Vaccinations[3] | # of Adverse Reactions | Risk of Adverse Reaction | Percentage | AEs/Mill. Vaccinations[3] |
|---|---|---|---|---|---|
| Flu | 167,447,642 | 9,704 | 1 in 17,256 | 0.005795% | 57.95 |
| COVID19 | 167,733,972 | 5120,414 | 1 in 322 | 0.3103% | 3,103 |
[1] number of flu vaccinations based on estimated flu vaccine coverage data from CDC and estimated population data from US Census. Yearly flu vaccination data covers a period of time from 7/1 to 5/31 of the following year.
[2] number of covid19 vaccinations based on estimates from Our World in Data [2] number of covid19 vaccinations based on estimates from Our World in Data
[3] Persons vaccinated with at least one dose.
Vaccine Data by Manufacturer
| Manufacturer | # of Deaths | % Deaths | Average Deaths/Day | # US Deaths | US Doses Administered | Average US Deaths/Mill. Doses | Days since EUA approval | EUA Approval Date- |
|---|---|---|---|---|---|---|---|---|
| Janssen (JNJ) | 1435 | 7.93% | 5.86 | 920 | 15,774,846 | 58.32 | 245 | 2/26/2021 |
| Moderna | 4431 | 24.5% | 14.07 | 3532 | 161,206,881 | 21.91 | 315 | 12/18/2020 |
| Pfizer/Biontech | 12158 | 67.22% | 37.76 | 3802 | 249,302,522 | 15.25 | 322 | 12/11/2020 |
| Unknown | 64 | 0.35% | 37 | 443,843 |
| Manufacturer | # of AEs | % AEs | Average AEs/Day | # US AEs | US Doses Administered | Average US AEs/Mill. Doses | Days since EUA approval | EUA Approval Date |
|---|---|---|---|---|---|---|---|---|
| Janssen (JNJ) | 65444 | 7.63% | 267.12 | 57630 | 15,774,846 | 3653.28 | 245 | 2/26/2021 |
| Moderna | 322655 | 37.6% | 1024.3 | 293856 | 161,206,881 | 1822.85 | 315 | 12/18/2020 |
| Pfizer/Biontech | 468217 | 54.56% | 1454.09 | 282753 | 249,302,522 | 1134.18 | 322 | 12/11/2020 |
| Unknown | 1831 | 0.21% | 1429 | 443,843 |
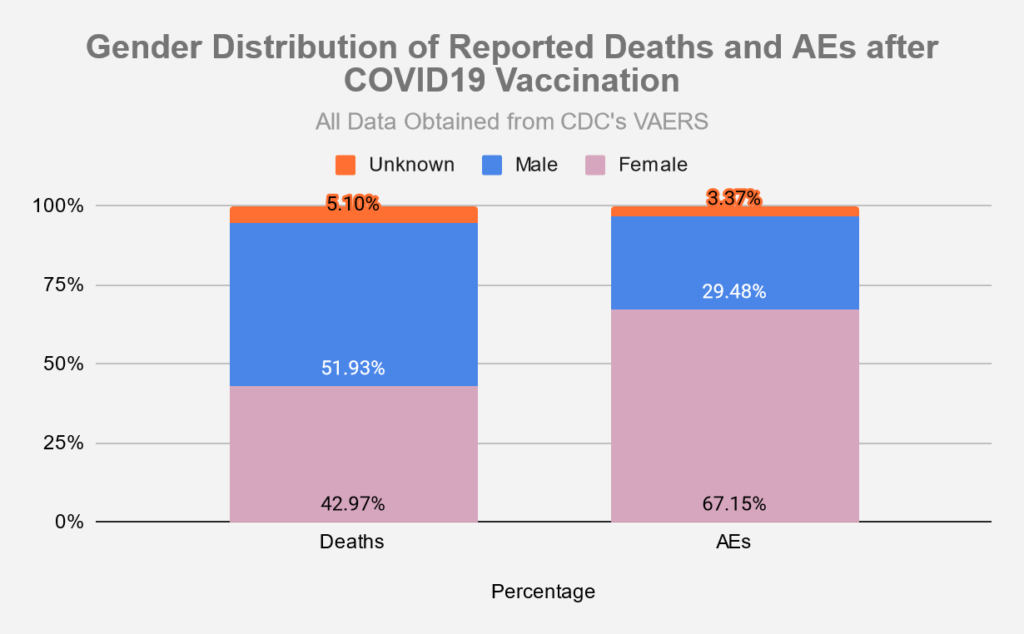
Vaccine Data by Gender
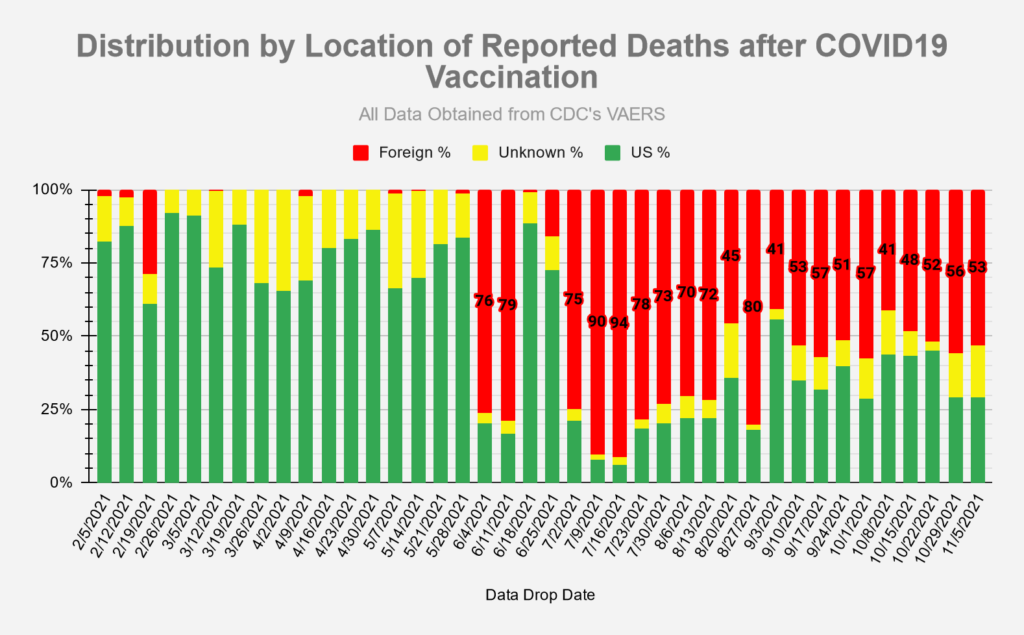
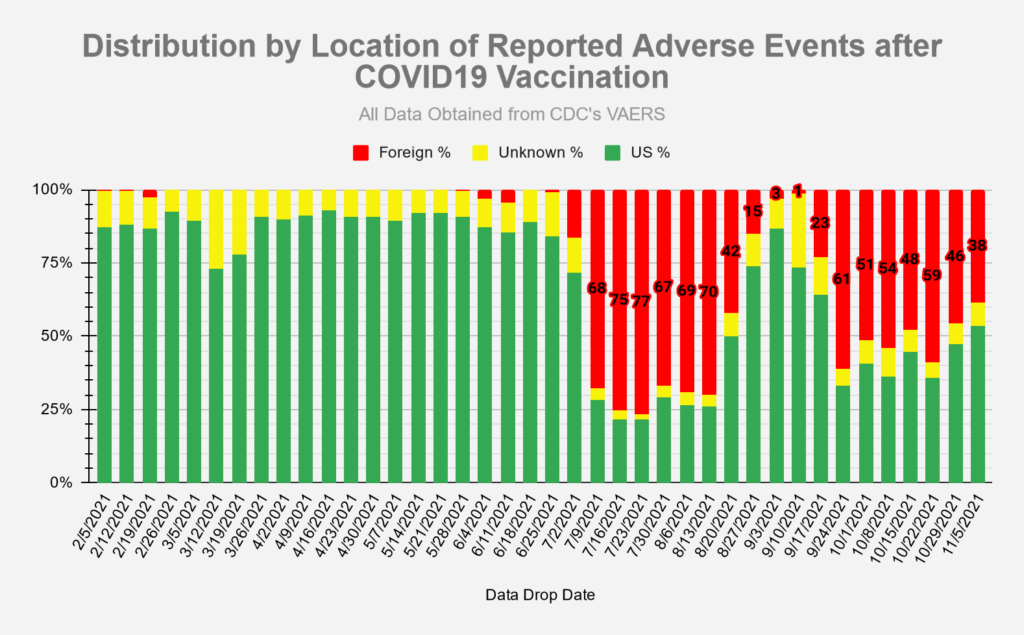
Vaccine Data by Location
Sources
- Vaccine data (Covid-19 and other vaccines) taken from CDC’s VAERS website, located here: https://vaers.hhs.gov/data/datasets.html. VAERS data sets in the form of csv files are pulled down weekly and put into a database for reporting/analysis. Data files are available all the way back to 1990.
- Number of doses distributed for other vaccines found in NVICP Data and Statistics report here: https://www.hrsa.gov/sites/default/files/hrsa/vaccine-compensation/data/data-statistics-report.pdf
- Numbers for Covid-19 vaccines administered by manufacturer found here: https://covid.cdc.gov/covid-data-tracker/#vaccinations_vacc-total-admin-rate-total
- Numbers for total Covid-19 vaccine doses administered found here: https://data.cdc.gov/Vaccinations/COVID-19-Vaccination-Trends-in-the-United-States-N/rh2h-3yt2
- Numbers for Flu vaccine doses administered for 2019-2020 season found here: https://www.cdc.gov/flu/fluvaxview/coverage-1920estimates.htm
[…] vaccination.” As of October 29, according to the weekly VAERS data analysis website, VAERS Analysis, 18,078 people have died from the COVID vaccine, which is more than “the number of deaths […]
This is fantastic. This page has been shared to thousands by me. Thank you!
No, Thank YOU, for sharing it with thousands!
Thank you so very much Wayne, i will share on my twitter account as much as possible though i do not have many subscribers. Thank you for your work.
As a side, since i am a linguist of accurate, correct, precise sound intelligent English (meaning not hijacked and destroyed and being destroyed by the leftist ideology), the word is sex not gender in those graphs, sigh, makes me go nuts as an Orwellite language custodian and purist;
*“If thought corrupts language, language can also corrupt thought. A bad usage can spread by tradition and imitation even among people who should and do know better.” * —- Cultural Marxism a.k.a. political correctness is indisputably intellectual colonialism and mental fascism for the gendering of “thought-crime.”
Thank you for sharing this site with others!
[…] VAERS Summary for COVID-19 Vaccines through 10/29/2021 […]
[…] VAERS Summary for COVID-19 Vaccines through 10/29/2021 […]
I was looking for data which was not written in Hegelian dialectic cryptology. The medical community is taking unto itself extreme damage to its reputation by reporting manipulated falsehood and by mandating nurses not to report adverse reactions in VAERs.
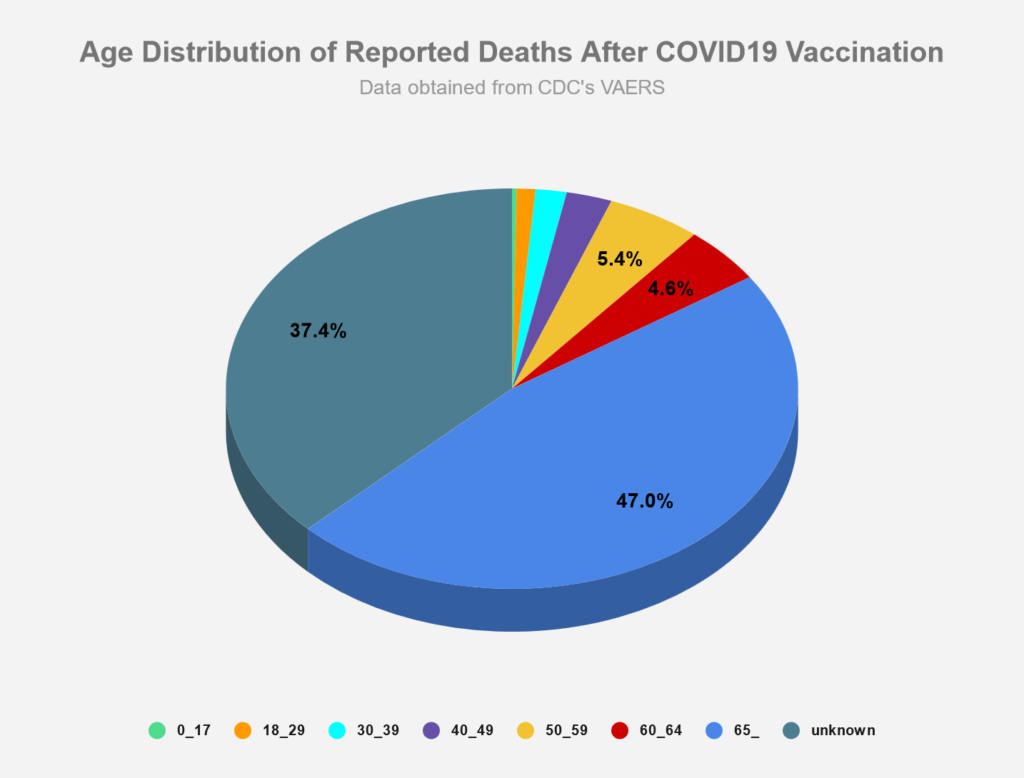
Your data is validated by the data I have analyzed from the state of Georgia, especially the fact that the vaccine adverse effects, especially deaths is far more prevalent in those 65 and older than the remainder of the population. This is concerning to me as we now know the NiH had a hand in gain of function research at the Wuhan lab, the epicenter of the virus release.
Data tells a story, and the obvious story unfolding here is that the virus and the vaccine, both have a much higher result of mortality in the elderly (65 +) than the remainder of the population combined. Statistically, it would be near impossible for such conditions without intervention.
Get ready, for there is no doubt that during these current trials relative to vaccine mandates, both yourself and your data will become involved at some point. Don’t be afraid of such intervention, I think the jury will be very open to the results of your analysis, because its genuine. Personal attacks against your credibility will occur in court however, they only serve to shore up your analysis, as those types of attacks appear in court to be extreme in partiality and egregious in intent to the jury.
Thanks for all your hard work, I for one am well aware of how time consuming and difficult such statistical analysis can be, however, please by all means keep this up…. Americans and others around the world need this data. They need to know the truth no mater pretty or ugly such truth might be… Further, if you need financial assistance to maintain this data, by all means put together a go fund me request…. Maybe as one alone we are not wealthy but as 100m we can prove to be quite wealthy.
I will no doubt be spreading this among all of my contacts and associations.
Thanks for the kind words. Please do share far and wide with others. Widespread awareness is what it will take to turn the tide.
[…] VAERS Summary for COVID-19 Vaccines through 10/29/2021 […]
[…] 我已经好久没有去观察VAERS系统的数据了,今天看到了一个数据分析专家做的最新每周分析报告,觉得还是跟大家分享一下。 […]
[…] numbers from the Center for Disease Control’s VAERS (Vaccine Adverse Event Reporting System) website show that the COVID-19 Vaccine has ended, crippled, and threatened more lives in 1 year than every […]
[…] take our word for it — just look at the U.S. government VAERS data, which analysts say is under-reported by a factor of at least […]
[…] worldwide. With World Health Organization and European Union databases, as well as the Vaccine Adverse Event Reporting System (VAERS), co-led by the FDA and CDC (Centers for Disease Control and Prevention), showing […]
[…] worldwide. With World Health Organization and European Union databases, as well as the Vaccine Adverse Event Reporting System (VAERS), co-led by the FDA and CDC (Centers for Disease Control and Prevention), showing […]
What’s the percentage of AE? Under Vaccine Data manufacturer? 7% Jansen 37% Modena 56% Pfizer
That seems extremely high number
[…] data has been recorded since 1990. Here is a table drawn from their existing data. (Source) We have highlighted the line comparing the statististics on […]
[…] raportate în toți acești ani este de 5.178. (Puteți citi analiza VAERS pe această temă AICI.) Situația s-a schimbat dramatic la sfârșitul anului 2020, când a început […]
[…] The graph below traces the number of deaths that have been reported to VAERS every year since its inception. As you can see, the yearly levels have held relatively steady from 1990 until 2020 and were generally under 400 cases. The cumulative total of all reported deaths during those years comes to 5,178 (see VAERS analysis here). […]
[…] The graph below traces the number of deaths that have been reported to VAERS every year since its inception. As you can see, the yearly levels have held relatively steady from 1990 until 2020 and were generally under 400 cases. The cumulative total of all reported deaths during those years comes to 5,178 (see VAERS analysis here). […]
[…] The graph below traces the number of deaths that have been reported to VAERS every year since its inception. As you can see, the yearly levels have held relatively steady from 1990 until 2020 and were generally under 400 cases. The cumulative total of all reported deaths during those years comes to 5,178 (see VAERS analysis here)… […]
[…] The graph below traces the number of deaths that have been reported to VAERS every year since its inception. As you can see, the yearly levels have held relatively steady from 1990 until 2020 and were generally under 400 cases. The cumulative total of all reported deaths during those years comes to 5,178 (see VAERS analysis here). […]
[…] The graph below traces the number of deaths that have been reported to VAERS every year since its inception. As you can see, the yearly levels have held relatively steady from 1990 until 2020 and were generally under 400 cases. The cumulative total of all reported deaths during those years comes to 5,178 (see VAERS analysis here). […]
[…] The graph below traces the number of deaths that have been reported to VAERS every year since its inception. As you can see, the yearly levels have held relatively steady from 1990 until 2020 and were generally under 400 cases. The cumulative total of all reported deaths during those years comes to 5,178 (see VAERS analysis here). […]
[…] The graph below traces the number of deaths that have been reported to VAERS every year since its inception. As you can see, the yearly levels have held relatively steady from 1990 until 2020 and were generally under 400 cases. The cumulative total of all reported deaths during those years comes to 5,178 (see VAERS analysis here)… […]
[…] The graph below traces the number of deaths that have been reported to VAERS every year since its inception. As you can see, the yearly levels have held relatively steady from 1990 until 2020 and were generally under 400 cases. The cumulative total of all reported deaths during those years comes to 5,178 (see VAERS analysis here). […]
Thank you, WayneTheDBA for ur statically analysis on the association between deaths and COVID vaccine. Although VAERS does NOT demonstrate a direct cause and effect, but it is an early/preliminary alarm system to warn there IS a POSSIBLE direct cause and effect that needs immediate attention and analysis by the CDC and governmental entities that is suppose to protect its citizens given such large alarming numbers.
We the people threaten by COVID and it’s non-stopping new variants need hope. Can you be known in the future history books as one of our saviors by doing a statistical analysis if level 3 mask (or higher) can REDUCE (not 100% prevent) the chance of catching COVID???
Thank you, Doc Peter
[…] https://vaersanalysis.info/2021/11/05/vaers-summary-for-covid-19-vaccines-through-10-29-2021/https://alethonews.com/2021/10/15/27247-deaths-2563768-injuries-following-covid-shots-in-european-database/https://ukfreedomproject.org/covid-19-vaccines-yellow-card-analysis/ […]
[…] VAERS Summary for COVID-19 Vaccines through 10/29/2021 […]
[…] Totalul general al tuturor deceselor raportate în toți acești ani este de 5.178. (Puteți citi analiza VAERS pe această temă aici.) […]